Predicting Pikachu gender with Logistic Regression
An analysis
Recently I was walking through the park on a relatively unremarkable day. I had Pokemon GO opened up on my phone and while I’m sure it’s happened many times before, especially during Pikachu “hat” events, for some reason on this day it stood out to me.
Two Pikachu: One male, one female. Three dimensional characters plotted on a two dimensional map. Dimensional also in the sense that the characters are intended to have personality traits - look how cute they are OH NO you tapped on them look at the rage! They also have different heights and weights and, as I mentioned, genders.
Others have written about sexism in the game as it relates to the presentation of Pokemon GO characters. Others have written about sexism in the game as it is played in the real world. This post is not for qualitative arguments about such topics (although that is not meant to deny there are arguments to be had about said topics.)
The work presented here involved collection of raw data, creating permutations of data, and running analyses in R (an open source, free statistical analysis software package) and Minitab.
Why both R and Minitab? R is a bit more complex in that it requires one to know how to code in R language. In graduate school I learned and really enjoyed using SAS, which also requires coding. Minitab is often used in business/enterprise settings as it employs Graphical User Interface (GUI).
Now, tables already exist showing showing max combat power (CP) for characters in the game. But do those tables actually line up with the distribution of Pokemon one may actually encounter in the game? Certainly, “perfect” Pokemon (those with 100% ratings in attack, defense, and health) are more rare.
My question was: Could you predict the gender of Pikachu based on those three independent variables?
Null Hypothesis: Higher max CP, higher weight, and taller height are not indicative of a seen/caught Pikachu being male.
Alternative Hypothesis: Higher max CP, higher weight, and taller height would all be more indicative of a seen/caught Pikachu being male.
For this I made a table breaking down the actual gender, height, weight, and max CP of Pikachu I have caught. To expand on the population sample, I ran permutations of that data to “create” more Pikachu that actually could be caught.
Infinite data points do not exist because max CP falls within a certain range, as do other criteria. This isn’t to suggest there are a small number of permutations. I didn’t create them all, but I imagine the possible permutations would be in the millions.
A sample of the data (for a binary response, which is what logistic regression predicts, 0 represented male and 1 represented female.)

My data was split 50% so that my regression equation, regardless of predictor variable (I ran the model to predict male), would hold. The equation:

And the coefficients:
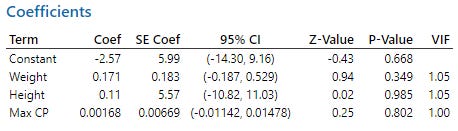
While the model itself was a good fit (with a P-value of 0.442, >0.05 - which is what you want for determining Goodness-of-Fit), you can see that the independent variables all have P-values >0.05 - which is not what you want. Essentially what this means it that none of the variables here are adequate predictors of Pikachu gender.
I also ran a fitted line plot for all three variable and while there is slope, based on the input variables you can see there is virtually zero predictability power to any of the three variables.


I also ran five predictions just out of curiosity. These numbers were not based on the permutations I ran, rather they were numbers I input based on the actual range of data (so it might be impossible to get a Pikachu that weights 7.5kg, has a height of 0.35m, and a max CP of 840, regardless of gender.)
Using the regression equation above, these were the five Pikachu, without gender:

For those five possibilities, in order, here are the fitted probabilities (closer to 0 indicates a prediction of male; closer to 1 indicates a prediction of female.)
0.47; 0.48; 0.60; 0.66; 0.54
The standard error of fit for these results is anywhere from 0.20 on the first set of numbers to 0.14 on the last set. As what we’re really seeking here is a number of <0.05 (for male) or >0.95 (for female), in order to have 95% confidence that our prediction is correct, you can see there is virtually no confidence that any of these predictions lean male or female precisely because the results themselves, and the SE of Fit and 95% Confidence Intervals all hover around 50%.
Given the data I used and the results from R and Minitab, we can say that the P-value of our test is >0.05 and statistically insignificant. We reject the alternative hypothesis and accept the null hypothesis.